My Largest Holding: A Real Estate Beast
Welcome to the +77 subscribers who joined this past week and are now part of 9,966 millionaires, CEO’s and high-performing entrepreneurs who read the #1 financial newsletter on Substack.
If you want access to my deep dives, stock picks, watchlists and portfolio management tips that will make your wealth explode, consider going paid below.
Weekly Market Update 🗒️💡
U.S. stocks wrapped up their worst week in 2023 after the most recent inflation report. If you haven’t noticed, everything is getting more expensive. Which means less money in our pockets! Who doesn’t love that?
The S&P 500 was down 2.7% this week, the worst performance for the S&P 500 since December 9th. Maybe a good time to buy some shares of your favorite S&P ETF. The Dow Jones fell close to 3% this week, which marks its 4th straight week closing out in the red.
Market sentiments:
Bullishness is below a historical average of 37.5% for the past 64/66 weeks.
Bearishness remains above its historical average of 31% for the past 61/66 weeks.
In other words, the bears are outnumbering the bulls. AKA more opportunity in the market.
Beyond Meat (ew) shares rose close to 10% after the company reported a loss that was smaller than expected, although demand continues to be an issue. Surprising… not.
Boeing shares fell ~5% after the company announced that it had halted the deliveries of hundreds of their Dreamliners.
My take: there’s so much uncertainty in the market right now. Some people are convinced we’re heading for a lengthy recession, some believe we’ve already seen the worst of it. I personally think the market has more room to fall. Investor confidence in the market isn’t great and we’re seeing a lot of people shift money into safer alternatives like bonds and income ETFs such as QYLD and JEPI to preserve their cash. In the meantime, I’m sticking to my strategy and will continue averaging down into my positions where possible.
Tweet of the Week

Everyone knows the price, but very few people know the value.
What is RioCan?
RioCan is a closed-end trust that is one of Canada’s largest REITs, with a total valuation of approximately $13.4 billion.
The REIT owns, manages, and develops mostly retail and mixed-use properties located in grade-A areas.
The retail portfolio accounts for ~86% of the REIT’s gross rent, followed by office at ~8.5% and residential at ~3% with the majority of their assets located in Canada’s most populated and fastest-growing cities such as Toronto, Vancouver, Calgary, Montreal, and Edmonton.
The REIT has a long roster of reliable tenants that are equipped to pay rent throughout a variety of different economic cycles, which is a powerful advantage considering the volatility in the economy.
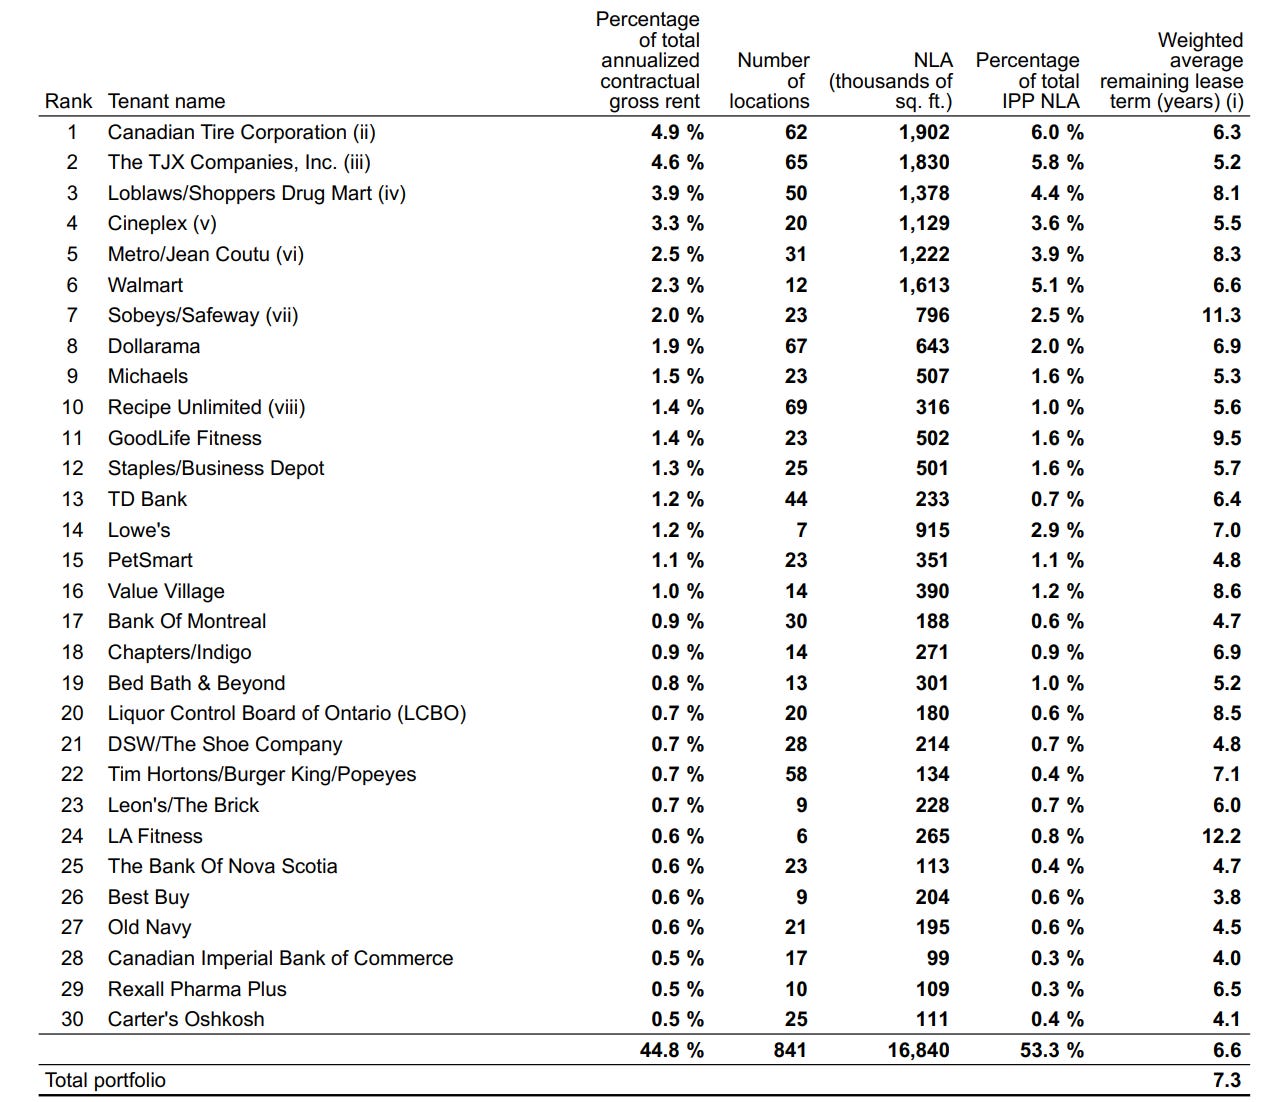
Top 30 Commercial Tenants
One of RioCan’s biggest strengths, in my opinion, is its quality of tenants. When analyzing REITs, I always make sure to get a better idea of who the tenants are and if they will be able to pay if there’s an economic downtown, which we’ve seen recently.
RioCan makes it a point to reduce their exposure to rental revenue risk, in other words, reduce their risk of not getting paid, through geographical diversification, staggered lease maturities, and avoidance of too much dependence on a single tenant (A.K.A. having all your eggs in one basket).
As of December 31, 2022, RioCan’s 30 largest commercial tenants are as follows:
Some notable names in there are Canadian Tire, Loblaws/Shoppers Drug Mart, Walmart, Dollarama, Lowe’s, Bank of Montreal, Bank of Nova Scotia and CIBC. These 30 companies make up ~45% of RioCan’s total contractural gross rent.
The Numbers (2021 ➡️ 2022)
Rental Revenue
Base rent 2021: $1.066 billion
Base rent 2022: $1.074 billion
A 0.7% increase from the previous year which can be attributed to higher occupancy, rental growth, acquisitions, and the completion of existing developments.
Operating Income
Operating income 2021: $701 million
Operating income 2022: $712 million
A 1.6% increase from the previous year which can be attributed to the higher net operating income (NOI) as a result of the completed developments.
FFO Per Unit - Diluted
FFO per Unit (Diluted) 2021: $1.60
FFO per Unit (Diluted) 2022: $1.71
A 6.9% increase that can be attributed to the higher NOI from residential properties and completed developments in the year, as well as unit buybacks that lowered the total number of outstanding units.
Net Income
Net Income 2021: $598 million
Net Income 2022: $236 million
A significant 60.4% decrease in net income due to the net fair value losses on investment properties as prices started to fall in 2022, as compared to the gains experienced in 2021. The total fair value loss of $241 million was impacted by increased capitalization rates which indicate higher risk assets.
Liquidity
Liquidity Q4 2021: $1.01 billion
Liquidity Q4 2022: $1.5 billion
A 53% increase in liquidity from the previous year’s Q4 which is mainly due to a $250 million increased limit on RioCan’s revolving unsecured operating line of credit, as well as $250 million of senior unsecured debentures that were issued in 2022.


