Stock prices ain't sh*t! Let's talk earnings and valuations (Ft: Jesse Cramer)
Welcome to the +94 subscribers who joined this past week and are now part of 5,964 millionaires, CEO’s and high-performing entrepreneurs who read the #1 financial newsletter on Substack.
My name is Alex and I love creating streams of passive income. My goal is to help you do the same.
If you’ve enjoyed The Profit Zone please take 30 seconds out of your day to share this newsletter, leave a like, or a comment. It means the world to me and costs you a total of $0. Thank you for the support! It doesn’t go unnoticed.
Announcement
Today’s issue of The Profit Zone is brought to you by one of my good friends Jesse Cramer, the Founder of The Best Interest. A while back, Jesse came to me with the opportunity to collab on a book Jesse was putting together featuring 30 different financial experts. To this day, it was one of the most exciting financial projects I have worked on since starting my journey online, and I’m so grateful to have been a part of it. That book is called Money Mastermind and it is 280+ pages and over 100 topics of the most important financial/investing knowledge you will ever get your hands on. I like to call it The Money Bible.
As a token of my appreciation, and to kick off this issue brought to you by Jesse himself, I have been given a discount code for The Profit Zone subscribers only.
If you would like to check out the book and grab a copy for 20% OFF, click below and use the code “dividends”. Enjoy your Money Bible!
And without further ado, here is Jesse Cramer on earnings and valuations
2022 has reminded stock market investors that returns are far from guaranteed. The S&P 500 hit a year-to-date low of -13.05% in early March. It's since recovered and is now only down 7.20% on the year (at the time of writing this).
But what's driving this change?
Investors Love VIX
Ok. A lame attempt at a cereal pun.
I don't know if "kids love Kix" anymore, but I do think the VIX is a great heuristic for investors.
The VIX measures volatility in S&P 500 options trades. When investors are uncertain about the future, they're likely to express that uncertainty via buying and selling options contracts (which expire sometime in the future). The VIX measures that.
In fact, some investors call the VIX the "fear index." Increases in the VIX correlate closely with uncertainty (fear) in the market. When the VIX is over 30, conditions are high-risk and fearful.
And the VIX surged in Q1 '22. The 30 threshold was surpassed in each of the past 4 months. Only in April has the VIX fallen to more stable levels.
This fear is understandable.
The Russia/Ukraine war inspired whispers of nuclear war. And even without a nuclear war, we're seeing the global impacts of conventional war. Commodities (oil, natural gas, grains) are especially affected. When will it end? Where will we be in a month? We don't know, hence the VIX rises.
The next issue is inflation, which is reaching 40-year highs. Consumers are frustrated and the U.S. Federal Reserve feels the need to raise interest rates to settle down runaway inflation. Interest rate hikes are bad for stocks. How many hikes will we see? Four? Six? Eight? We don't know, hence the VIX rises.
Uncertainty and fear inspire investors to seek safer shelters than stocks.
Or does it? Is that the whole story?
Back to Basics
I love the price-to-earnings (P/E) ratio. It contains so much useful information in a succinct package.
The price of a stock represents how the market values a company. It's the average of thousands of investors' subjective opinions.
The earnings, however, are objective. How much money did the company earn this past quarter? It's a plain fact.
Thus, the P/E ratio compares investors' collective opinions against the cold truth of the company's earnings, all in one quick number.
A P/E of 20 means that investors will pay $20 today for $1 of current earnings. What a bad deal...right??? Who would trade a $20 bill for a $1 bill? It makes no sense.
Of course, investors expect more than $1 over one year. They expect a stream of earnings to roll in, year after year after year. Ideally, they want those earnings to increase over time. Investors are banking that the discounted cash flow of all future earnings will exceed $20.
High P/E ratios are a sign of bullishness and optimism. Investors will pay more today because they believe future earnings will repay them in kind.
Low P/E ratios are a sign of bearishness and pessimism. Investors worry that future earnings will be weak. They're unwilling to pay much for those earnings today.
P/E and 2022
What have we seen in 2022? We know that stock prices are dropping. But are earnings dropping too?
No. They're not. Earnings are stronger than they've ever been.
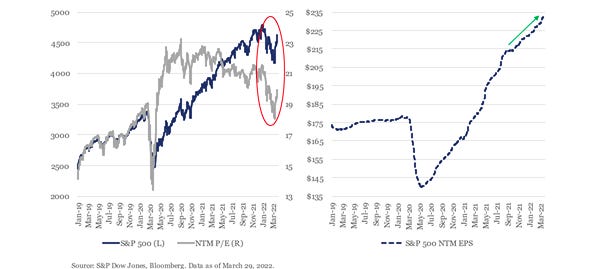
On the left chart, we see the S&P 500 price (in blue) and the S&P's next 12 months' P/E (in gray) sharply dropping at the beginning of 2022. Yet on the right chart, we see the S&P 500 next 12 months' earnings-per-share continuing to rise.
The numerator of P/E is decreasing. Yet the denominator is increasing. The subjective opinions about stocks are growing more pessimistic, even as the objective earnings from those stocks are rising. How can this be?
Mr. Market
The legendary Benjamin Graham famously quipped,
"In the short run, the market is a voting machine. In the long run, it's a weighing machine.” - Ben Graham
The P/E ratio captures both sides of Graham's quote.
Votes are opinions. They're subjective. They change quickly. And they're captured in a stock's price.
But weight is objective. It's a fact. It changes slowly. And it's captured in a stock's earnings.
The market has been unsure how to vote in 2022, even as the objective "weight" of the market has slowly improved. And this is reminiscent of another Ben Graham investing parable: the story of Mr. Market.
P/E ratios can swing wildly based on irrational investor sentiment. When prices are irrationally low, it can be a great time to buy. When prices are irrationally high, a great time to sell.
The market frequently swings between these two extremes, from "unjustifiable euphoria" to "manic depression." Neither extreme is rational.
And as Graham instructed his followers, you don't have to listen to Mr. Market at all. Your ideal response is to buy from Mr. Market when he's depressed and sell to him when he's manic. This is easier said than done.
Even though earnings are as strong as they've ever been, we need to ask ourselves: were the prices at the end of 2021 rational or irrational? Therefore, is the P/E change in 2022 a change from irrational to rational, or vice versa?
Are We Rational or Irrational?
How do we determine if prices are rational or irrational? If we knew for sure, we’d all be billionaires by now. But we can try nonetheless! For starters, let's compare our current position to past history.
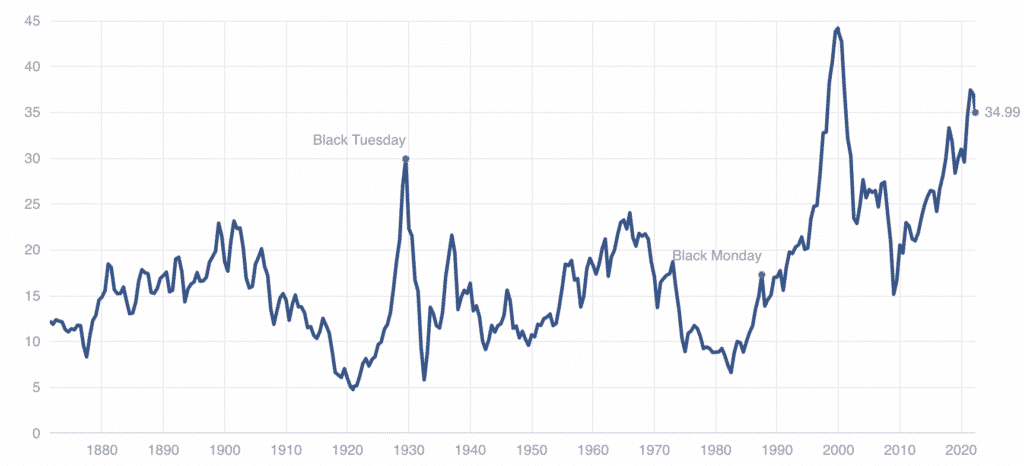
This chart shows Robert Shiller's cyclically-adjusted P/E ratio, or CAPE. It's generally considered a superior form of P/E ratio since it takes business and economic cycles into account by averaging P/E ratios over time.
You can see the CAPE all-time high was right before the "Dot Com Bubble" burst. Stocks were irrationally overpriced then.
We are currently near those all-time CAPE highs. The "easy" conclusion is that investors are paying irrationally high prices for stocks. The 2022 change in price is a move towards rational realism. Perhaps we shouldn't pay $35 for $1 of earnings.
But there are CAPE detractors, and they have an interesting point. Their main argument is that technology changes everything. In the era of 20th-century manufacturing, it was expensive for companies to increase their revenue. It required more land, more labor, more assembly lines, etc. The future earnings of any company were tempered by the marginal cost of new profits.
But digitization changes that. Software companies typically have huge gross margins since it's so simple for them to sell more of their product. They don't require more laborers, more land, or more intensive capital investments. It's cheap and easy for them to grow their earnings.
That's why many investors believe modern companies should not be compared to past companies, and modern CAPE value shouldn't be compared to past CAPE.
In other words, perhaps a P/E or CAPE of 20 was "rational" in the 20th century. But in the 21st century, tech optimists would argue that a P/E of 30, 40, or higher is the new "rational."
Simply put, companies can grow their earnings more easily.
The Argument: Who's Rational?
Was Aesop correct that a bird in hand is worth two in the bush? Depends on the P/E ratio.
Similarly, it's unclear who is correct in the market right now. That's one of the beauties of market economics. A price gets set when half of consumers think the price is a fair buy, and the other half think it's a fair sell. Who is right? Only time will tell.
The important takeaway today is that earnings are growing and valuations are falling. The objective measurables are getting stronger, but opinions about the future grow pessimistic. The market has always been about subjective viewpoints of objective measurables, and it's still true today.
I'm sorry that I can't give you a buy or sell recommendation. Candidly, I'm not smart enough to do that. I can tell you that I'm continuing to trickle my investing dollars into a diversified portfolio---a chunk of each paycheck into my 401(k) and $500 a month into my Roth IRA. I'm still buying.
But beyond that, I'm watching and waiting and learning. There's always something new to learn from the market, and 2022 has been a perfect example.
Jesse Cramer is the founder of The Best Interest and has written for CNBC, The Motley Fool, and Yahoo Finance. He lives in Rochester, NY with his fiancee Kelly and their dog, Sadie. Subscribe to Jesse’s blog and learn more about his book, Money Mastermind, here.


